The TRC Computer Ratings algorithm is highly adaptable to different racing conditions around the world and can rate horses on a level playing field, no matter the competition, no matter whether conditions stretch out the runners – as on soft going in Europe – or shrink the distances between them – as on firm going in Japan.

Given this, there is no reason why we can’t run the algorithm on non-Group and Graded races which form the bulk of each country’s domestic programme.
To provide an example of how TRC Computer Ratings could be plugged into the data for Australia, USA, Japan, Hong Kong, France, Dubai or anywhere else, let’s apply the computational engine to just a subset of racing in Britain and Ireland, confining the data set to the particular challenge of their 2020 season of domestic racing for juveniles.
Why both countries together? Because their results are strongly connected by the horses who ship between them; we could easily have done either country in isolation, but this is more informative.
Why juveniles? Well, these races are challenging for any algorithm because of the paucity of data. How to handle races where there is scant previous form? How to adjust for the wide variety of ground and track conditions.
This is a proper challenge – and a most interesting one at this time of year with the Derby and Guineas just around the corner in both countries.
Before we integrate domestic data, let’s look at some of the best racing performances in Group races for juveniles in Britain and Ireland last year, according to our published numbers on March 3 at 12:00 BST:
In all, there are 12,220 performances to rate. This would take humans hundreds of hours, but a fast computer takes under a second. Let’s go down the order of merit.
First, let’s look at the top 25 performances NOT in Group races:
Because of the unique methodology of TRC Performance Ratings, some of the performances in this list are rated much higher than elsewhere. For example, we have Just Beautiful on TRC 101, compared with Racing Post Ratings (RPR) 86. Now, there’s nothing wrong at all with the RPR, as defined by their own methodology of exchanging distance linearly for rating points, but TRC Performance Ratings is solving a different question: Given the horse has won two out of two and given that her two wins came at Kempton, what is the middle of the distribution of ratings consistent with this data?
Similarly, Beautiful Bertie has won two out of four races, novice events at Lingfield and Chelmsford on the all-weather surfaces. The TRC system has a rating of 101 for her – verging on listed class – because her wins came by five lengths and three lengths under relatively fast conditions.
Now let’s go flying down the rankings to the 25 performances who start the second thousand overall:
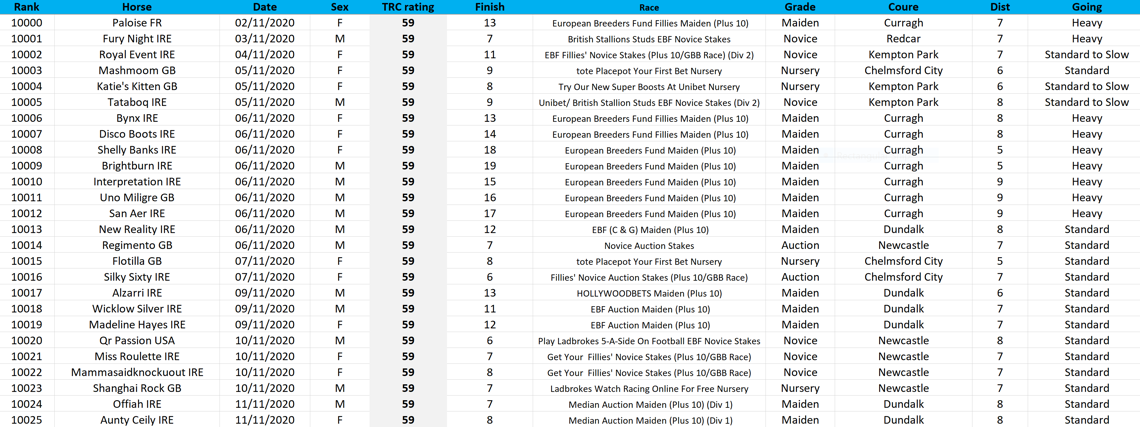
Finally, here are the performances the TRC Computer Race Ratings ranks #10,000-10,025:
Hopefully, these few examples show the scope of the TRC ratings algorithm and how harnessing a machine to solve a carefully designed optimisation problem – how do you systematically use the data of race results to make the most effective ratings – allows for a sometimes radically different set of ratings to emerge.
As we have said all along, rating racehorses is no more and no less than an optimisation problem. But the key point is to give the computer the machinery to learn from the task of trying to predict winners. As a result, it knows to be aggressive with winning margins – sometimes a neck is worth as much as 3 rating points, for instance - and sometimes conservative with wide margins under testing conditions.
The distances between horses at the end of a race is far less important that the order of finish, according to our research. An effective ratings system has to be founded on this principle, rather than getting bogged down in x lengths always equally y points.
If you are a conventional handicapper and you have a horse running to 80 twice to start its career, there is a good chance it is actually a 90 horse. If you have one running to 80 twice at the end of a 10-race sequence, and these are its best efforts, chances are it is an 80 horse. The same margins at the end of races systematically translate to different points on the ratings continuum – so your numbers should reflect this reality, in our opinion.
If you allow the computer to treat the order of finish as far more important than the distances, horses suddenly appear far more consistent. If you don’t believe us, click on a horse’s name in our rankings table and see its best efforts sorted. A ratings system should be trying to achieve the two following objectives:
1) It should try to separate horses in terms of merit as much as possible – it should maximise the variance between horses’ records;
2) It should try to have horses running to the same narrow range of ratings as much as possible – it should minimise the variance within horses’ records.
These two ambitions are obviously in tension with one another; as margins translate to larger differences in ranking points, 1) gets bigger but so does 2).
A human has no shot whatsoever to solve a problem like this. This is no disrespect to any human, it is just a ground truth of computation. Human handicappers should be engaged teaching computers the nuances of horseracing and researching new ideas for algorithms, not spending hours and hours on work that computers do better.


